MS 150 Statistics

Course in Canvas Commons (16 week version)
Stats: A playlist of statistical videos
Introduction to Statistics Using Google Sheets™ Edition 6.1

Term | LMS | Final examination topic
Spring 2023 sn1 calendar and syllabus Canvas
Fall 2022 sm3 calendar and syllabus Canvas: Stair steps
Summer 2022 sm2 calendar and syllabus Canvas: Lelu
Spring 2022 sm1 calendar and syllabus Canvas: PM 2.5
Fall 2021 sl3 calendar and syllabus Canvas: Hula hoops
Summer 2021 sl2 calendar and syllabus Canvas: Page views
Spring 2021 sl1 calendar and syllabus Canvas: Disengagement
Fall 2020 sk3 calendar and syllabus Schoology: Cash power
Summer 2020 sk2 calendar and syllabus Schoology: UA redux
Spring 2020 sk1 calendar and syllabus Classes ended March 16: pandemic
Fall 2019 sj3 calendar and syllabus Schoology: UA HOVR Guardian
Spring 2019 sj1 calendar and syllabus Schoology: iNaturalist
Fall 2018 si3 calendar and syllabus Schoology: Insight Timer data
Spring 2018 si1 calendar and syllabus Schoology: Rainfall data
Fall 2017 sh3 calendar and syllabus Schoology: Dausokele run data
Spring 2017 sh1 calendar and syllabus Schoology: Moves app steps, cadence vs. speed
Fall 2016 sg3 calendar and syllabus Schoology: Harrassment definition survey results
Summer 2016 sg2 calendar and syllabus Schoology: Prince and Stairway to Heaven
Spring 2016 sg1 calendar and syllabus • t01 • t02 mx • t03 • t04 fx purple
Fall 2015 sf3 calendar and syllabus • t01 • t02 mx • t03 • t04 fx MAD
Spring 2015 sf1 calendar and syllabus • t01 • t02 mx • t03 • t04 fx running mileage
Fall 2014 se3 calendar and syllabus • t01 • t02 mx • t03 • t04 fx United
Spring 2014 se1 calendar and syllabus • t01 • t02 mx • t03 • t04 fx bermudagrass
Fall 2013 sd1 calendar and syllabus • t01 • t02 mx • t03 • t04 fx sweetie-chuuk
Spring 2013 sd1 calendar and syllabus • t01 • t02 mx • t03 • fx olmchs-relay
Fall 2012 sc3 calendar and syllabus • t01 • t02 mx • t03 • t04 fx solar-nitrogen [odx]
Spring 2012 sc1 calendar and syllabus • t01 • t02 mx • t03 • fx topper
Fall 2011 sb3 calendar and syllabus • t01 • t02 mx • t03 • fx waves
Spring 2011 sb1 calendar and syllabus • t01 • t02 mx • t03 • fx mansuit
Fall 2010 sa3 calendar and syllabus • t01 • t02 mx • t03 • fx kosrae pop

Introduction to Statistics Using LibreOffice.org Calc, Apache OpenOffice.org Calc, and Gnumeric Edition 5.3 [deprecated]
Links for mobile accessibity [deprecated]

Spring 2010
Spreadsheets Quizzes and Tests
Calendar
Syllabus
Course Outline
Assessment
Project
A second sample statistics project

Attaching files in Yahoo!
Email addresses for life commentary

FSM Statistics Unit
Pacificweb.org
FSM Census projections

Social media survey spring 2010
Favorite colors
Flickr favorite color
Baby names! • Local
Baby name choices of students fall 2009

Dubious distinctions:
Number two in obesity
Number two in marijuana usage
Intentional injury reported by young people in Pohnpei • Full text pdf
Kaselehlie Press coverage of intentional injury article

Social media survey spring 2010
Favorite colors

Social media data chart
Height, weight, body fat data • .xls • .html

RipStik Linear Regression Homework • .xls • .html
Marble homework due Monday 22 Feb • .xls • .html
Pennies.ods
Resting heart rate due Wednesday 10 March • .xls • .html
Worksheet 07 due 15 March 2010
Essay performance data
Data for homework due 07 April 2010
Data for homework due 09 April 2010 t3.xls • t3.html
q01 08 Jan 2010
q02 15 Jan 2010: chapter one textbook material
q03 2.2 MySpace friends • soln
t1 3.4 Bebo friends
q04 4.2 Run to U and back
q05 5.1 RipStik Learning Curve
t2 mx skateboards 4.4 • t2a
q06 6.2 7.3a Run times and normal curves • ans
ws07 7.5 GNH
q08 9.12 68% CI Bebo friends
t3 running 7.5 9.2 • t3a
q09 9.2 10.2 MySpace friends
q10 11.1 Momentum before versus after
q11 11.2 Physical science quiz year-on-year
q12 4.3 Baby growth data

Rice Soap Dish fx 11.2
Data • Soln
Fall 2009
Spreadsheets Quizzes and Tests
Calendar
Course Outline
Assessment report 14 Dec 2009
Project
A second sample statistics project
Favorite colors • html
Baby name choices of students fall 2009
BFI • xls • html
The 12 most annoying types of Facebookers • Survey
Male body fat homework solution .ods
Pacific obesity rate alarming 5.3 transportation survey
Pennies • .ods
Linguistic Inquiry and Word Count (LIWC)
Coral pH study by J. Kibby • .ods
T-Test HW • .ods
College's too-fat-graduate rule under fire
q01 pre
q02 1.3 levels of measure
q03 2.3 soap density • html
t1 3.4 Red hot wonders ❧ t1a
q04 4.4 • soln
q05 5.3 steps
t2 mx tension 5.3 • t2a
q06 6.2 friend statistics mean age • q06a
q07 7.3 gross national happiness
q08 9.2 refraction
t3 9.3 sound • t3a
q09 6.2 FaceBook mean age
q10 10.2 Intergalactic Blackhole palladium
q11 11.1 • Data
q12r 4.4
fx Back to Basics • data • soln
Spring 2009
Spreadsheets Quizzes and Tests
Calendar
Course Outline
Project
Assessment
Favorite colors • html
Local
Baby name choices of students fall 2008
BFI • xls • html
Tech communication survey data including SMS
Term-on-term assessment results
Google docs
hw0213
Social media survey raw data
Social media blog report
SMART board day one
Confidence interval worksheet 26 March
t statistic MathMl file
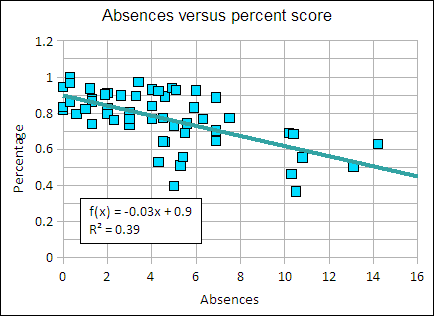
Correlation of attendance and performance 19 April
q01 pre
q02 1.1 levels
q03 2.2 sms
t1 3.4 Social networks
q04 4.2 banana ramp
• q04a
q05 4.4 yeast respiration
• q05a
q06 5.3 p(social media) • html
t2 midterm marble mania • soln
q07 6.2 Santarch
q08 7.3 [recycled s73 q06]
q09 7.5 echo speed • q09a
q10 9.2 centerline redux • html
t3 9.2 index of refraction
q11 10.3 blue spotted grouper
q12 11.1 NBFS neg split?
q13 11.2 Xavier SDA COMET
END vs MZ4 fx ☿ html
Fall 2008
Spreadsheets Quizzes and Tests
Calendar
Course Outline
Project
Favorite colors • html
Baby names! • Local
Baby name choices of students fall 2008
Long term weight loss is a challenge
Body fat data • Excel format • web page html
Long run
Low probability event • NV
pennies • xls • html
Guava • html
Refractive index .ods • html • xls
november paired t-test.ods • Excel xls • html
november paired t-test soln • html
Assessment report
Prequiz 15 Aug 15
q01 1.3 Aug 22
q02 2.2 Aug 29
t1 3.4 Sep 05 • t1a
q03 4.3 12 Sep
q04 4.4 19 Sep
q05.html
t2 midterm • soln
q06 7.1
q07 7.5
t3 9.2 • t3a.html
q08 10.2 • .html
q09 11.2 2.2r
q10 3.6r
q11 4.4r
Spreadsheet for building xhtml
Far beyond pedometers fx • ans • data
Summer 2008
Spreadsheets Quizzes and Tests
Calendar
Course Outline
Project
Favorite colors summer 2008 • ods
Favorite colors • xls • ods
Body fat spreadsheet • ods • html
Pennies.ods
Youth pedometer data
Dorm TV confidence interval
BFI July
Long term weight loss is a challenge
test one 2.2
t1a
test two 4.3
t2 xhtml variant
test three (midterm) 5.3
t4 Normal Distribution 7.5
test five confidence interval
test six paired t-test for the means
Coastal fx (final examination)
Data sheet for final
t7a
Spring 2008
Spreadsheets Quizzes and Tests
Calendar
Course Outline
Project
Favorite colors
Random function examples • Excel format
Day name spreadsheet
Body fat data • xls • html
Marble race: an advanced stat project
HW 11 Feb • xls • html
Pennies homework 03/05 • html
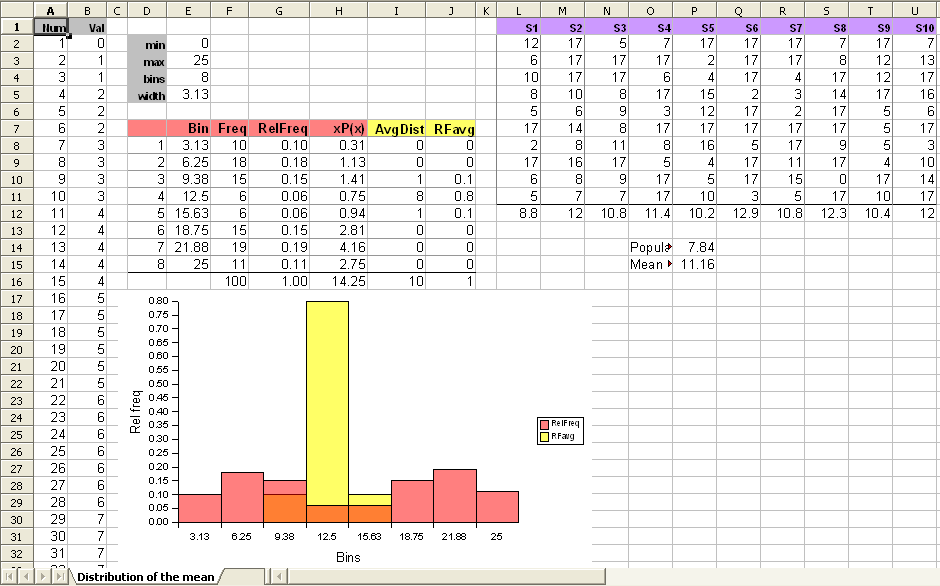
distribution of the sample mean
Body fat paired t-test 4/21 • xls • html
Activity levels among college students as measured by a pedometer • PDF
Activity levels among second grade students as measured by a pedometer • PDF
Activity levels versus age • PDF
Prequiz 11 Jan 08 • html
q01 1.3
q02 2.2 • t1 3.4
q03 4.4 q04 5.1 • q04heat.ods
q05sms
q05a
t2 mx megasteps
q06 7.1
q04 7.4
t2 9.2 • t2a html
q08 9.3 ci p
q09 10.2 hyp test
q10 10.3 p-value
q11 11.2 hyp test indep samples
q12 linear regression
q13 page one of whirlpool
q14 confidence interval
Steps fx • data sheet
ans
Fall 2007
SpreadsheetsQuizzes and Tests
Calendar
Course Outline
Finding the calculator and spreadsheet
Calc vs Excel differences • odt
Favorite colors • .ods
Flickr favorite color
Baby names!
First names • .ods
Body fat key
FSM rank in obesity
World's Fattest Countries complete list
New World Syndrome
Island Food Community of Pohnpei
Exercise, not diet, the key
Obesity Epidemic Threatens Health in Exercise-Deprived Societies

Pareto chart example • .ods
HW 8:30 class: male body fat histograms
HW 9:30 class: female body fat histograms

Body fat data as a web page
body fat ods [A204 lab only]
body fat xls [library and elsewhere]
HW 0829 body fat .ods
When a histogram shape forced a change • .ods
Ages of students 2007
linear regressions • xls • html
ballbounce.ods • Excel version
Making an XY scattergraph with Excel or OpenOffice
Linear regression/best fit line practice • ans
q04 5.1
Fav color rel freq prob 6.1
hw 0929 ods
psychoactive substance survey
Female height normal curve
Pennies and the normal curve
formulae.odg
21 Nov BFI homework Excel • .ods • .ods
Marble size independent ttest.ods • html
Prequiz
q01 1.2
q02 2.3
t1 fish 3.4 • t1a html
q03 4.4
q04 5.1
q05 6.1
t2 mx metals 7.1 • ans
q06 7.2 (7.4)
q07 7.3 (7.5)
q08 9.0 • ans
t3 refraction 9.2 [née t2]
t2a • ods
q09 10.1 • ans
Worksheet 10 10.2
q11 11.1
q12 11.2 fonts • ans
q13 4.4 linear reg review • q13a
Jump rope fx
data sheet
ans and analysis
Summer 2007
Spreadsheets Quizzes and Tests
Calendar
Course Outline
Finding the calculator and spreadsheet
Calc vs Excel differences • odt
Favorite colors
Body fat data
BFI male data for a number of terms
Population 2007 • html • openoffice calc ods file
In class age distribution example ods only
In class ESL 079 distribution example ods only
EN 110 Distribution homework • html • .ods
Tennis ball bounce histogram: MS • WK
superballs
Gates-McGinite correlation
 .ods • .html
Yap 1947
Goby larval stage length
Pennies.xls • .ods
Utilities data sheet
Goby larval stage length
Cigarette butt data
Normal distribution worksheet
Market ci
Hypothesis test worksheet
CI worksheet
Superballs worksheet
BFI differences term start to end
t1 2.3
t2 3.1 • t2a.xls • t2a.html
Midterm 4.4 • html
t3 normal dist
t4.odt tinv ci
t5 ttest indep samples • pdf
 t5a 11.2 [OOo Calc text]
 t5a.xls
Homeless fx
 homeless.html
Spring 2007
Spreadsheets Quizzes and Tests
Calendar
Course Outline
Body fat data • xls
Female height data work
Homework 2.4 p84
Golf ball drop ods
HW 9.2 2a 10 • ods
FSM 2000 soln html • ods • xls
2005 Housing Income and Expenditure Survey
FSM 2005 Housing Survey (local copy)
Pennies data
Mean of means
World Health Org FSM Obesity data
CI HW using t-distribution • .xls • html
Fair die?
q01
q02 • data xls
t1 2.4 • t1a
xls
q03 lin reg • q03a ods Excel: xls
q04 power bills
Mx • ans
q05 confidence interval using NORMINV
html
q06
t2 ci • ans • pdf
q07 • q07a.ods
q08.ods t-test independent samples
q09 Linear regression review quiz
q10 review histograms, ci • q10a.html
Glaciers • data • .pdf
Fall 2006
SpreadsheetsQuizzes and Tests
Calendar
Assignments overview
Baby names rank order popularity
body fat.ods • xls • html
L1 data from JG • html
Vilfredo Pareto
Creating histograms with Excel • odt
Creating histograms with OpenOffice.org Calc • odt
HW 3.1 ods • html • xls
HW 3.2 ods
Golf ball drop • html • xls
HW 4.3 • html
Pohnpei 1958 • Yap 1947 • All-in-one
Track laps • html
Pennies.ods • .xls (Excel)
Cherry leaf measurements ods • html • xls
One hundred confidence intervals
Traffic study project
Variation in the confidence interval with change in the sample size n
Traffic study data
Effect of c on interval: two t c.i.
Hypothesis testing
Pehleng • Pehleng.xls
PreQuiz
q01 1.2
Quiz 2 2.2
t1 3.2 • t1a • xls
q03 4.2 • html • xls
q04 5.1 • q05 6.1
Midterm 6.1 • html
q06 6.1 pennies odt • html
q07 7.3a • q08 7.3b
q09 9.1
t2
q10 hyp test with confidence interval 9-10 • q11 hyp test 10.3 10.4
q12 linear regression review • q12a
q13
Sakau • data • fxa
Spring 2006
Spreadsheets Quizzes and Tests
Calendar
Course Outline
xls • html • ods
Central tendency • html • ods
FSM 2000 data • m10 soln
Alcohol survey
pennies • html • ods
x to z to area to the left of z
x to z to area with normal curve displayed
Guava leaf lengths
sample mean to z to area
Linear correlation species .ods
confidence interval
confidence interval z
confidence interval t • .ods
Duke pre-post.ods
EC-300 calibration lin reg
data • .ods
bloodpressure • .ods
PreQuiz • s53fxa
q01 • q02 2.2
t1 3.2 • t1a
q03 4.2 • html Community
q04 5.1
Midterm • html
q05 7.1 • q6 7.3a
q7 7.3b
t2 9.2
Q08 9-10
Q09 hypothesis
Q10 review quiz
Found data fx • fxa
Fall 2005
Spreadsheets Quizzes and Tests
Calendar
BFI xls • html • ods
rain.ods
Frequency function
Another frequency explanation • xls
Homework 3.2 p100 • html • ods
Drop bounce xls • html • ods
Run to NBFS • html • ods
raise one eyebrow • html • ods
Pohnpei population 1958 • html • ods
Pennies • html • ods
PICS CHS normal 7.3
PICS CHS normal 7.3 • ods
Guava leaf lengths
Guava confidence intervals
Hypothesis test worksheet
BFI paired t-test • html • ods
Fibobelly 11.3 • html • ods
p488 #1 • html • ods
Belly button ratio: M9
Belly button ratio: M9 & M10
Q01 1.1
Q02 2.2 • html
Q03 3.2 • html
t1 4.2 • html
Q04 4.2 • html
Q05 6.1 • html
Mx 6.1 • html
Q07 7.3 • html
q08 9.2
t2 9.4 • html
q09 9-10 • q10 10 • q11 11.1
q12 r4.3
html
Faraway Rainbow
data • html
Generating spreadsheet • xls
Spring 2005
Spreadsheets Quizzes and Tests
calendar
bfi • html • sxc
Pop data • html • sxc
8 bin hw • html • sxc
run hw data
run html sxc
Yap 47 • html • sxc
substance use • html • sxc
Pennies
tracklanes • sxc
Pick ten • html • sxc • ods
ci to hypothesis test
Kosrae High School
HS data • + stats
Duke Kahanamoku
xll • xla1 • xla2 • xla3
ADV XHS CCA
Lap worksheet • ans • sxc
Quiz 1
q2 2.1 • html
t1 2.2 • html
Q3 4.2 • Q4 5.1 • Q5 6.1
Mx 6.3 • html
q06 6.1 • html
q07 7.3
q08 9.2 • html
t2 • t2a • html
q9 hyp test • html
q10 binom hyp • sxw • odt
q11 r4.3 • Some solns
q12 r3.2 + ci
Fish • data sheet • ods • html
Fall 2004
SpreadsheetsQuizzes and Tests
Calendar
BFI • html • sxc
High School • html • sxc
Body fat HW • html • sxc
Central tendency handout
sxc • xls
Track laps central tendency hw
  ans •  html • sxc
lin reg hw • html • sxc
bounce ans • html • sxc
Non-linear regression
Infant mortality homework
 xls • html • sxc
Mean from RF • html • sxc
xls • html • sxc
Track laps redux • html • sxc
 ans • html • sxc
track laps normal • html • sxc
PICS essay • html • sxc
Normal statistics with curve
Sample mean normal statistics with curve • sxc
Female bfi homework
roasting coffee homework
z versus t confidence interval
Confidence interval based on t
t ci bats!
ci to hypothesis
Duke paired t-test
Bats
Daily temps for Pohnpei for 47 years!
Quiz 1 1.2 • Quiz 2 2.1
t1 2.2 • html
q3 3.2 • q4 4.3
q5 6.1 • html
MX Tires • html
q6 7.2
q7 7.3 • q7a
t2 7.3 • q8 9.1 • xls
q9 ci hyp test 9-10
q10 hyp test
q11 r4.3 • q11a
q12 • html • oos
Fitness • html
Spring 2004
SpreadsheetsQuizzes and Tests
Calendar
Charts • html • sxc
Linear xls • html • sxc
M&M's® xls • html • M&M's® web site • sxc
z to x • Normal statistics
High School data • sxc
Body fat end m9 • m10
V = iR 3.3 review • html • sxc • sxw
q1 1.1
q2 1.4 • q2a
t1 2.2 • html
q3 3.2 • html
q4 4.1
q5 5.1 • html
Mx 5.1 • html

html
q07 6.1
t2 6.3
q8 7 • q9 82
q10 94
q11 r3.3 (s23q3 s23q10)
html
Golfdrop fx • ans
Quizzes, Tests, Midterms, and Finals
Fall 2003 Spring 2003 Fall 2002
q01 1.1 • q02 1.4
q02 ans • t1 2.2 • t1 2.2a
q03 3.3 • q04 4.1
Mx 5.1 • html

WS q05 • html
q06 6.2 • t2 6.3
q07 8.1 • html
q08 8-9 • q09 3.3rev
ws10 1.4 5.1 • html
s33q11 • html
Whirlpool fx • ans
Q1 1.1 • Q2 1.4 Bins
T1 2.2 • T1 Ans
Q3 3.1 • Q4 3.3 4.1
Midx 5.1 • Mx Ans

District two 2003
Penny distribution
Q5 5.1 6.1 • Q6 6.3
T2 6 8.2
Q8 8.1 Q9 9.1
Q10 3.3 Revisited
Freeway fx
Dev worksheet
Q01 1.1 • Q02 1.4
Test 1 2.2
Q03 3.3 • Q04 4.1
Midterm 4.1 •
Q05 5.1 • Penny lab results
Q06 6.2 • T2 6.3
Q07 8.1 • Q08 8 - 9
Q09 9.4 • Q10 3.3r
Tuna CPUE fx • fxa
Spring 2002 Fall 2001 Summer 2001 Spring 2001 Fall 2000
Quiz 01 1.3
Test 01 2.1
Quiz 02 3.1
Quiz 03 3.3
Midterm
Quiz 04 5.1
Quiz 05 6.1
Test 2 6.3
Quiz 06 8.1
Quiz 07 8 - 9
Quiz 08 9.4
Micro
Q01 1.2
Q02 1.4
Test 01 2
Q03 3
Q04 4.1
Q05 4.2
Midterm 5.1
Q06 6.1
Q07 6.3
Q09 8.2
Q10 8-9
Q11 9.4+
Q12 10.1
Q13 10.2
Infant fx
Final data
Quiz 01 1
Test 01 123
Quiz 02 4
Mid 12345
Quiz 03 6
Test Two 78
Quiz 04 9
Adult lit
Quiz 01
Quiz 02
Test 01
PostTest Survey
Quiz 03
Quiz 04
Quiz 05
Midterm
Solns w/ student
comments

Decline doc
Q06 6.1
Q07 6.3
Quiz 08 8.1
Quiz 09 8.4
Quiz 10 9.1
Quiz 11 9.4
Life exp fx
Quiz 1
Q02 1.4
T01 2.3
Q03 3.3
Quiz 4
Mx 5.2
Q05 6.1
Q06 6.3
Q07 7.3
T2 7.1
Q08 8.2
Q09
Q10
Fx
Support Materials
Fall 2003 Spring 2003 Fall 2002
Calendar
Body Fat Data • html • sxc
Pop. Pareto • (html)
PE Survey sxc
Female BFI histo from class
Male body fat histo • html • sxc
Utwe
2.2 handout • html • sxc
Soy Sauce Worksheets
Soysauce example • html • sxc
Waikiki Soy xls • html • sxc
Soy Data M09 xls • html • sxc
Soy data M10 xls • html • sxc
Alcohol xls • html • sxc
Pennies • PNG • sxc
Normal statistics • sxc
Distribution of the mean
Poll
Conf Int • Pulse • sxc
Calendar/Syllabus
Course Outline
Excel
OpenOffice Calc
Age Hist 5.1 xls
Norm dist xls • html • sxc
Homework exemplar
Mean Dist • png • sxc
Entrance ci worksheet
Conf Interval 8.2 for 14 April
Paired Mean WS • sxc •
T-test: Two sample for means
Excel
Calendar
Spring 2002 Fall 2001 Summer 2001 Spring 2001 Fall 2000
Excel
Calendar
Excel
Syllabus
Excel Excel
Syllabus
Non-linear curve
Excel
Calendar

Courses • COMFSM